“On TV And Video” is a column exploring opportunities and challenges in advanced TV and video.
Today’s column is written by Philip Inghelbrecht, co-founder and CEO at Tatari.
To date, TV advertising campaigns have been bucketed in two groups: They are either direct-response (DR) or branding campaigns.
The general opinion is that campaigns must exclusively belong to one or the other. Many advertisers think that DR ads are meant to drive responses and cannot build brand, or vice versa.
This is, however, an antiquated notion. DR and brand building can live within the same campaign or creative, and each can be objectively measured.
When people watch TV today, many do so while using another device, like a smartphone, in their hand. As a result, the traditional or aggressive call to action – “Call 1-800” or “But, wait, there’s more!” – is no longer needed. A soft call to action is all that is necessary to make a TV ad interactive and drive response, without damaging the brand.
These creatives can be called “brand response” ads. Geico is a great example: Its campaign included elements of both direct response (“15 minutes can save you 15%”) and brand (a friendly, relatable gecko).
Some of the Peloton creatives achieve a similar blend: The creative explains the product and encourages the viewer to join (“Let’s go”), yet it also appeals to people’s aspiration for being a better spouse and parent by exercising at home, which equates to the brand.
In that sense, advertisers should always aim to measure the brand impact of their DR campaigns. This does not suggest a brand awareness study conducted via surveys. Instead, it should be a statistically relevant approach that tells advertisers which viewers responded to the TV campaign later in time.
This measurement can be done with a closed-loop study. To understand how the latter works, advertisers first need to quantify the relationship between direct and brand response via the drag factor.

The drag factor
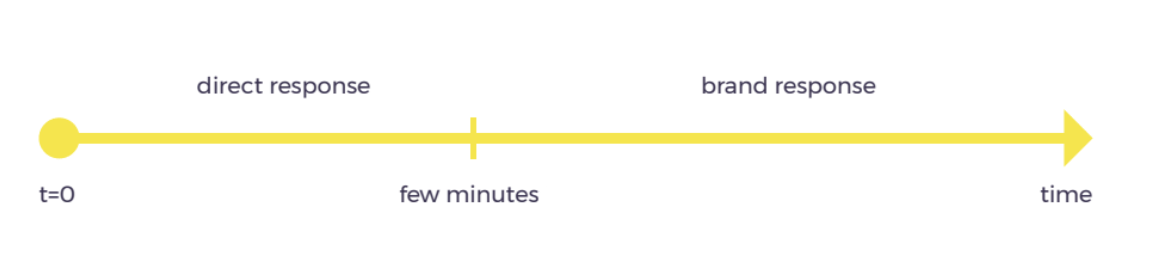
As can be seen in the following figure, direct response is immediate, which means that it can be calculated by measuring the key performance index, such as cost per visitor or cost per install, within minutes after a TV ad has aired.
Brand response, on the other hand, is latent and cannot be measured directly because it occurs later in time, possibly even months after the ad aired.
total response = direct response + brand response
The drag factor is a number that quantifies the relationship between these two types of responses. It can be expressed via the following formula:
drag factor = 1 + brand response / direct response
A good way to understand this formula is to try out a few hypothetical values for the drag factor. If the drag factor is equal to 1, then there are no latent responders to the advertiser’s campaign or the campaign has no brand impact whatsoever.
If, on the other hand, the drag factor is equal to three, that means that every direct responder would be followed by two brand responders. Closed-loop measurement aims to precisely quantify the drag factor and, therefore, the brand response.
The basics of closed-loop measurement
To perform a closed-loop measurement, advertisers first need to purchase viewership data. Viewership data provides information on the exposure of an anonymized IP address, which is usually synonymous to a unique household through the home’s Wi-Fi router, to a specific spot airing. By matching the IP address of a TV viewer who was exposed to the creative with the IP addresses from the website, one can isolate viewers who were exposed to an ad but went to the advertiser’s website (much) later. This approach “closes the loop” between the TV ad and the website or app-store visit.
Closing the loop enables advertisers to build a response maturity curve, which plots viewers’ response behavior as a function of time. In plain English, it lays out the probability of TV viewers visiting the website or installing an app at a particular point in time after last seeing the ad on TV. An example is shown in a hypothetical scenario below.
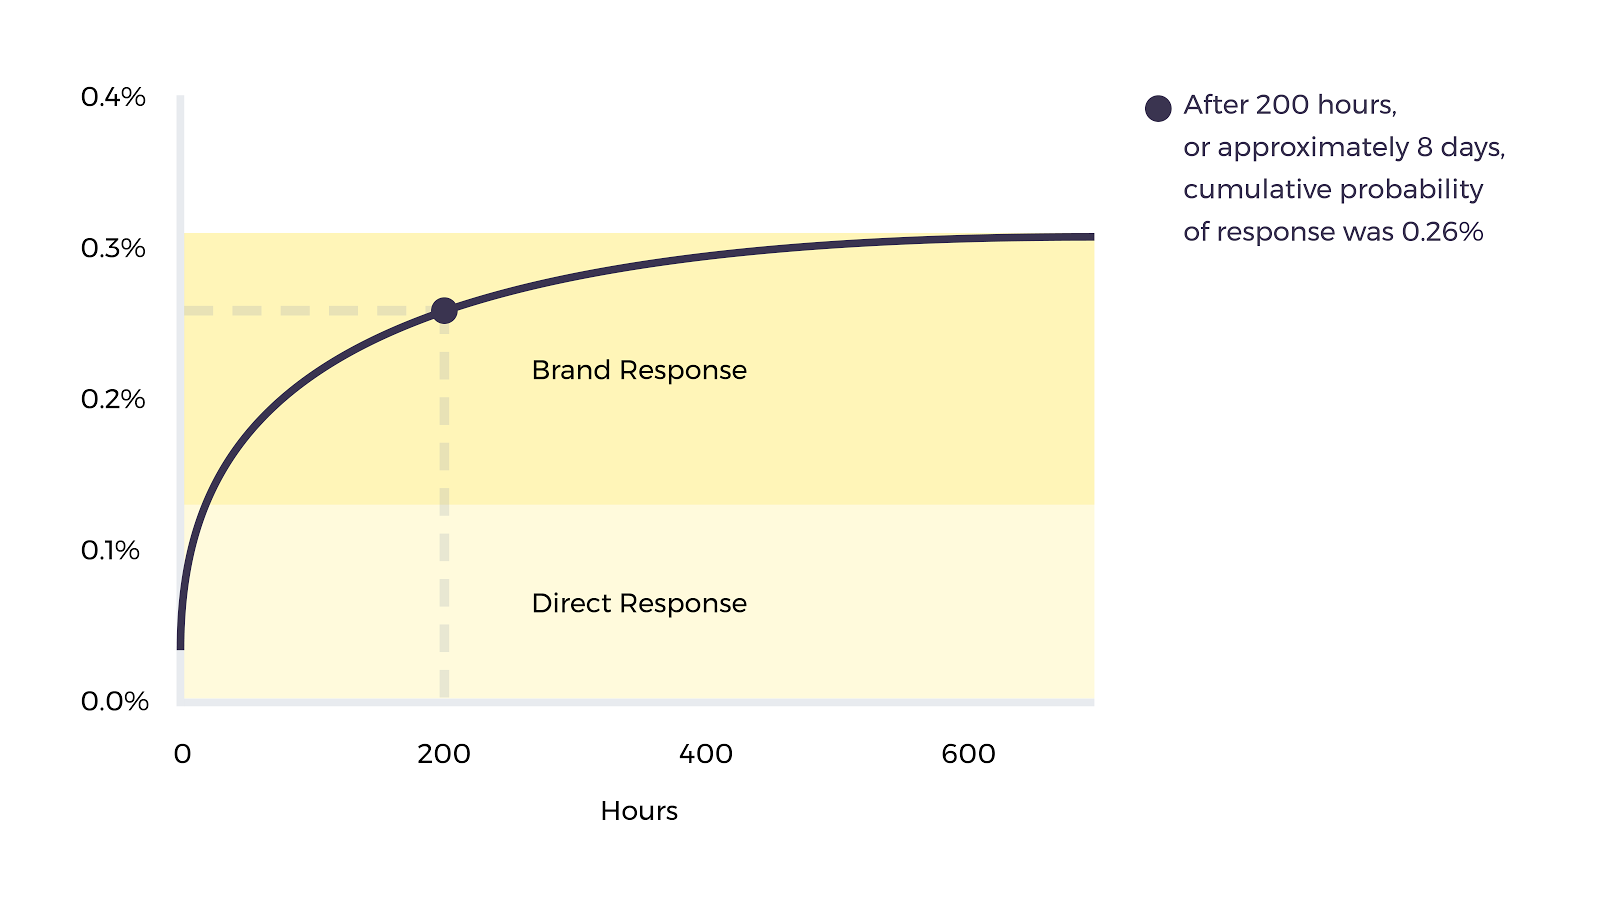
The horizontal axis displays the time (in hours) since airing that a viewer responds to the ad, while the vertical axis represents the probability of total response. Therefore, at t=0 – the moment the ad airs, which is the equivalent of a direct response – the probability of someone responding to the commercial is 0.13%. The curve then grows and approaches a steady value, with each time point corresponding to a particular probability of total response.
For instance, after eight days, or approximately 200 hours, the probability of total response is around 0.26%. Using these probabilities for total and direct response, advertisers can easily calculate the drag factor using the previously mentioned formulas. Since most TV sets sold today are IP-enabled, these calculated probabilities become increasingly representative of the overall TV viewing population.
Limitations of closed-loop measurement
Of course, as is the case with every measurement approach, closed-loop studies have their limitations. The obvious one is that viewership data is expensive, which can hinder advertisers with limited budgets for TV advertising.
It is also important to note that brand response in the context of closed-loop studies refers only to the delayed effect of a direct exposure to a TV ad. In other words, closed-loop studies cannot measure delayed response that happens as a result of an “offline” (or indirect) exposure to a TV ad. This can include word-of-mouth recommendations between friends, seeing the advertiser’s TV ad at a friend’s house or in a bar or hearing about an advertiser on news or social media.
That said, by providing greater insight into the brand impact of DR campaigns, closed-loop studies can give advertisers peace of mind as they spend their dollars on TV advertising. Eventually, the brand will have a positive impact on the company beyond measurable response, from the halo effect typically experienced with better performance in digital campaigns to the use of the company name and brand in everyday lingo (“Shazam a song”).
Follow Tatari (@TatariTV) and AdExchanger (@adexchanger) on Twitter.