 Twitter tried to avoid last quarter’s narrative, centered around flagging audience growth, in its Q1 call Tuesday; instead, the company emphasized a 28% quarterly increase in ad engagements (specifically retweets and favorites), driven by higher-quality ads and the use of rich media. Such was the overall theme: engagement over timeline views and audience growth. Yet, the fact remains the latter two are still down.
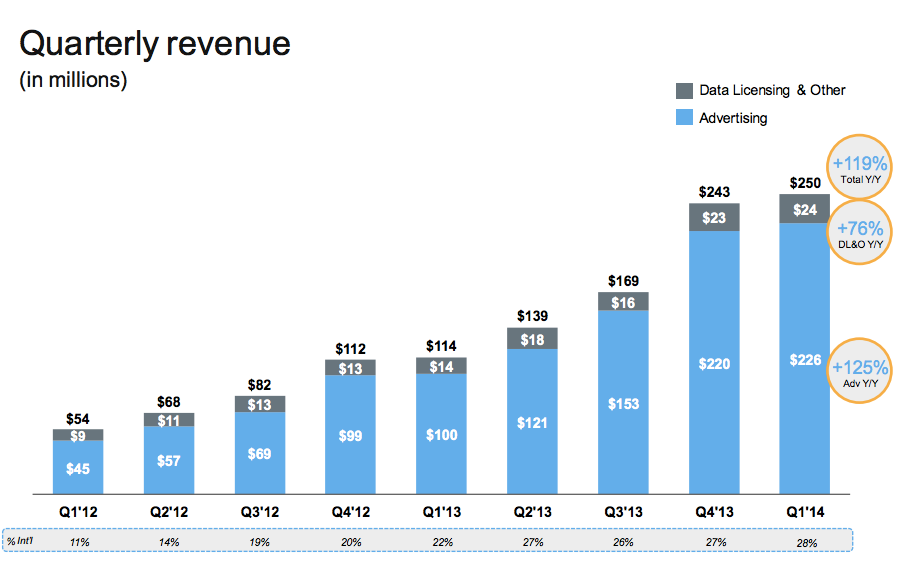
First, the good news: CEO Dick Costolo said user engagement (as well as user growth) drove Twitter’s posted Q1 2014 revenue of $250 million, an increase of 119% year over year. This is above the $240 million Wall Street analysts generally expected.
The bulk of revenue comes from advertising, totaling $226 million in Q1, a 125% year-over-year increase. Mobile advertising constituted around 80% of advertising revenue; last quarter, it accounted for 75%.
Ultimately, CFO Mike Gupta said the “strong quarter” was driven by demand in the United States for Twitter’s advertising tools and services, such as Twitter Amplify, around live events (notably the Super Bowl, Olympics, Oscars and Grammys) and improved measuring capabilities.

Brands, Costolo said, have been better at using Twitter as a second screen, engaging with audiences while events happen in real time. He pointed to Heineken’s “Share the Sofa” campaign from last September during the European soccer season, in which fans using the #ShareTheSofa hashtag could win a visit from a star athlete during a televised match.
Gupta cautioned however that there were fewer major live events in Q2, though he anticipated revenue around $270 million to $280 million.
Twitter’s audience, the sore spot for the social network last quarter when its year-over-year increase slowed to 30%, was once again in Q1 2014, despite 3 million new users in the United States and 11 million internationally. Globally, this means Twitter has 255 million active users (MAUs) as of March 31, 2014, an even slower increase of 25% year over year (19% increase in the United States; 27% internationally).
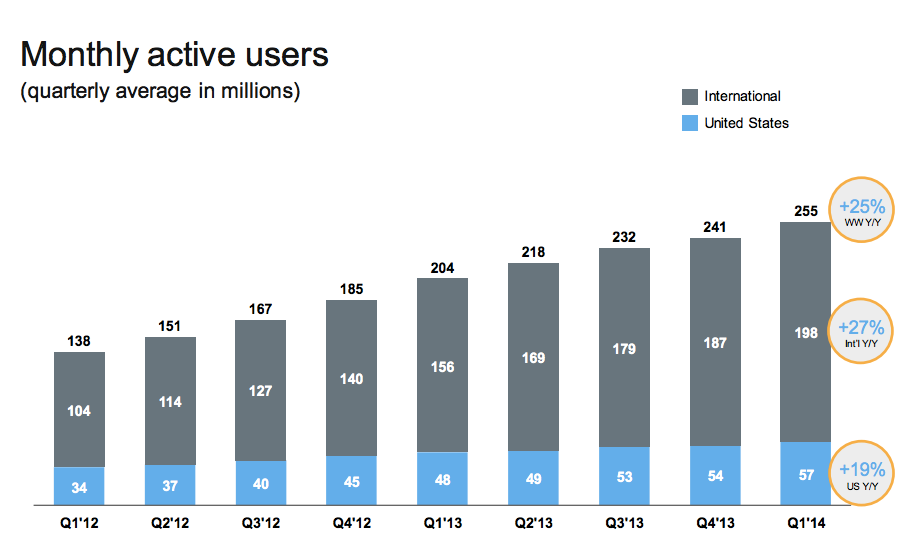
Mobile MAUs clocked in at 198 million, an increase of 31% year over year – not quite as substantial as Facebook’s 43% year over year, reported in the latter’s Q1 2014. That being said, a greater percentage of Twitter users are mobile; 78% of Twitter’s Q1 2014 MAUs are mobile compared to 68% of Facebook’s.
Not everyone is fixated on audience growth rates – at least as they pertain to the United States. In a note from Pivotal Research Group, senior research analyst Brian Wieser said investors last quarter were “overly focused” on this metric.
“Absence of significant growth would be unsurprising to us given our view of Twitter as a niche consumer proposition in most markets (if still one with a passionate user base),” he wrote.
Twitter, instead, prefers to focus on driving user engagement of Tweets that show up on the timeline. This was a contentious subject last quarter when the number of timeline views declined to 148 billion. In Q1 2014, timeline views reached 157 billion, an increase of 15% year over year. This is a recovery of sorts, but still below Twitter’s high, posted in Q3 2013, of 159 billion.
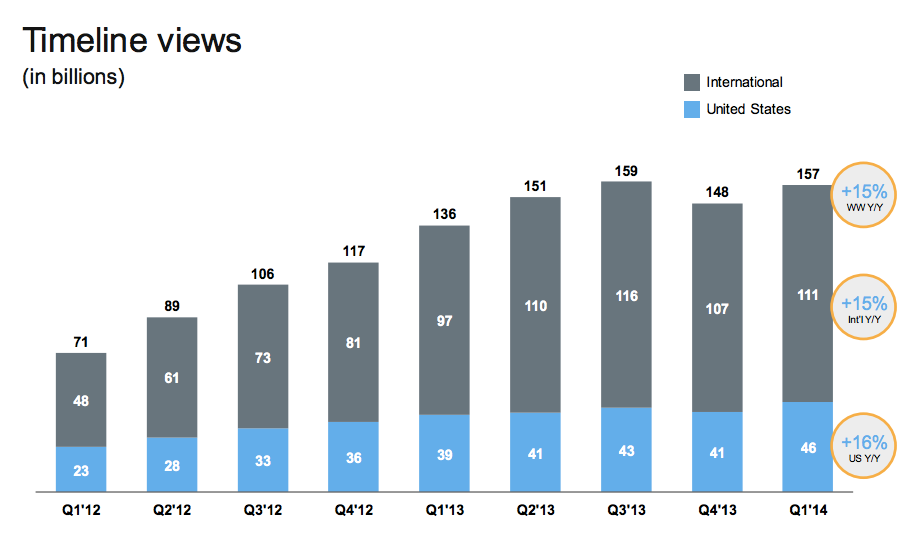
But Mike Gupta pointed out the company has been working to increase the value of the timeline, noting the 28% increase in retweets and favorites from Q4 2013. Both Gupta and Costolo emphasized that the 14 million new Twitter users acquired globally over the quarter are just as engaged as existing users.
“That engagement per timeline flows all the way through to monetization, as you see reflected in our results,” Costolo said. As he did during last quarter’s call, Costolo shrugged off the decline in timeline views, saying that this was a necessary byproduct of Twitter’s attempts to enhance timeline value.
Case in point, he said, users once had to hop between timelines to engage in different conversations, which would inflate view rates. Because that process has been streamlined, Costolo said, timeline views are down, the user experience is improved.
This is also why Twitter said its ad loads are low.
“We’ve had the luxury of being able to improve the timeline and monetization without increasing ad load,” Gupta said, emphasizing the focus is on improving the user experience which, in turn, will drive more engagement in the ad space and by extension greater ad revenues.
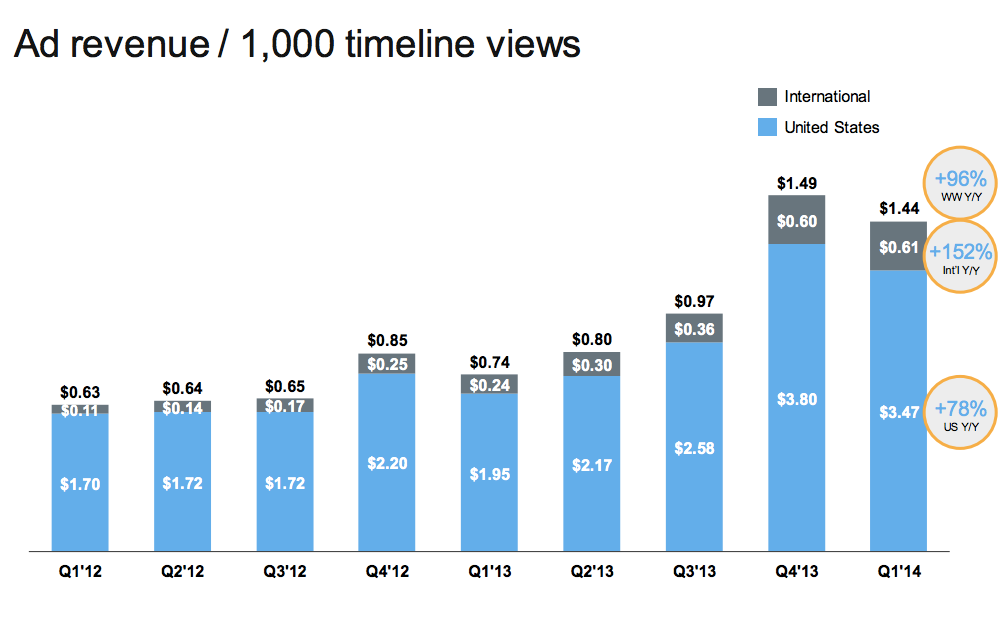
And those revenues were strong this quarter: Ad revenue per 1,000 timeline views increased 96% year over year (152% internationally and 78% in the United States). But strong revenue and engagement notwithstanding, audience acquisition remains a concern.