 However much click tracking, psychographic surveying, and big data analysis marketers do, few have a solid understanding of how their customers engage with social marketing content — or how those customers’ behavior differs between commercial and non-commercial interactions.
To address the knowledge gap, Forrester Research has come up with a “Social Technographics Score,” a model that focuses strictly on commercial social behaviors to help marketers choose social strategies based on their target audience’s behaviors and the lifecycle of the customer relationship.
“We know, for example, that older people are engaged with social media for things like sending messages and sharing photos, but they aren’t terribly engaged with brands and companies,” said Nate Elliott, VP and principal analyst. “The difference between overall social behaviors and commercial behaviors is an important distinction that many companies are missing.”

In its survey of more than 60,000 people in 21 countries, Forrester identified four social profiles
- Social Stars demand social interactions with companies and brands. The people who fit into this category are free spending, hungry to own the best brands, and relatively receptive to marketing messages.
- Social Savvies expect social interactions with companies and brands. They consider social tools an everyday part of their lives.
- Social Snackers appreciate social interactions with companies and brands. They don’t shy away from branded interactions, but they seek them out infrequently.
- Social Skippers spurn social interactions with companies and brands. They prefer traditional channels such as e-mail, catalogs, and bricks-and-mortar stores. They’re relatively older and are neither brand-conscious nor receptive to marketing.
Forrester says 19 percent of U.S. online adults are Social Stars, while 37 percent are Social Skippers. The overall U.S. score is 29 (on a scale of 100), higher than most western European countries but lower than emerging markets such as Russia and India, where tech-savvy early adopters are still the core of the online audience.
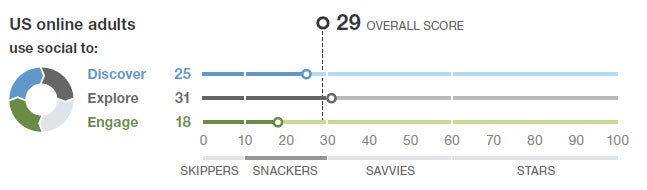
Elliot hastened to point out that these scores are neither good nor bad and don’t imply any kind value judgment; they simply reflect the current state of an audience’s social engagement with companies and brands. Forrester says it can generate a Social Technographics Score for any company to help its marketers decide whether social should be integral to its marketing plan.
And because customers relate to different social touch points at different points in the lifecycle of their brand relationship, Elliott said, it’s important to break down that cycle into three phases — Discover, Explore, and Engage — and rate each to understand when in the cycle to engage the audience for the most impact. Once marketers know these scores for their customers, they can fine tune an online marketing approach that will have the most social impact and have maximum appeal to as many customers as possible. They may even decide not to bother with online marketing at all if the numbers tell them no one is actively engaged.
“Social media is simply another tool for marketers, just like TV and display advertising,” said Elliott. “It’s about finding the best avenue to market to any given audience. The Social Technographics Score helps marketers understand how big a part of their overall plan social marketing should be. Marketers know they have to study their audience, and it’s no different online. That analysis will be the foundation of social success.”