 “Data-Driven Thinking” is written by members of the media community and contains fresh ideas on the digital revolution in media.
Today’s column is written by Matt Scharf, manager of display media operations and analytics at Adobe.
Contrary to popular belief, out-of-view impressions aren’t worthless.
As controversial as that sounds, impressions that are never seen can hold significant value to marketers. It’s not because they help drive conversions – they don’t, of course – but because they can help marketers develop control groups to evaluate media with more methodological rigor and less heavy lifting.
Adobe’s Project Iceberg, which identified out-of-view impressions at the event level (impression level for each cookie) and removed them from attribution consideration, revealed another compelling benefit that actually gives credence to the presence of out-of-view impressions. We used the Data Workbench capability within Adobe Analytics Premium to uncover the naturally occurring test and control groups in the data. We call it Project Iceberg 2.0.

If you’ve ever been involved in a study leveraging a test and control group, often referred to as “media effectiveness,” “true lift study,” “view-through analysis” or “incrementality study,” you’d know it takes a lot of planning, coordination, media spending, analysis and waiting for results just to make important future decisions based on findings from a static period of time. That pain can be alleviated with an always-on control and test group predicated on viewability and a data platform allowing for easy analysis.
The Traditional Method
The traditional way to develop a control group requires marketers to carve out a portion of their budget – often 10% to 20% – and enable the ad server to serve banners from a nonprofit organization, such as the Red Cross. This is the standard approach in the industry and requires marketers to knowingly limit their media effectiveness by serving ads that aren’t their own.
And after a month or two and sometimes longer, you can evaluate the results by comparing how your test and control groups convert against the same KPI while ensuring no cross-contamination between the groups. The idea is to see a resulting lift of the test group, who are people exposed to your company’s message, over the control group, or people not exposed to the message. This validates that display media works and quantifies how much incrementality it drives. It also shows causality of display impressions and resulting view through conversions.

The New Way
Now, instead of chalking up these out-of-view impressions to an industry flaw, marketers can leverage this data to our advantage. Viewability measurement is now at our fingertips.
If you’re buying media on exchange or network inventory at scale, you’re likely serving millions or billions of impressions. At the same time, you are inadvertently developing large, naturally occurring and mutually exclusive test and control groups. The test group is comprised of users exposed to viewable impressions and nothing else. The control group is made of users only exposed to out-of-view impressions.
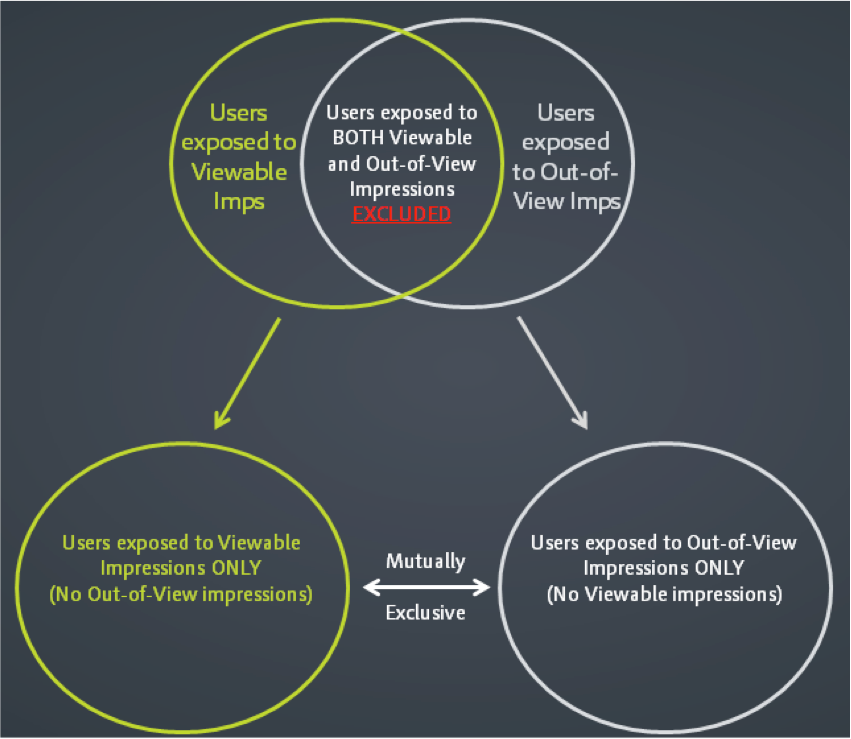
The results: mutually exclusive and naturally occurring test and control groups, just like the traditional approach. You could argue that it’s more advanced compared to the traditional way because previous studies done didn’t consider whether the impression was actually viewable or not. There’s a chance that some studies understated the value of display media because the test group was potentially made up of people who were served only out-of-view impressions and never saw the impression. Or half of the impressions in those test groups may have been out of view. Either scenario could have compromised or diluted the test group performance and skewed any data regarding the true frequency.

With Project Iceberg 2.0, the definition of our test and control groups depends on whether an impression was viewable or not, and whether users were exposed to only viewable impressions or only out-of-view impressions.
Comparing The Methods
The traditional approach to establishing a control group is done by removing cookies from your addressable audience so they cannot see your company’s ad impressions. In the alternate method, the control group includes users only exposed to out-of-view impressions. In both methods, the control group never saw your company’s ad.

The credibility of this type of study is that the test and control groups are clean, uncontaminated, mutually exclusive, randomly assigned and made up of similar people. Both approaches can achieve this to the extent they can control it in the traditional way or find it in the data with the new way. One comes at a cost and requires setup and time. The other is naturally occurring and free but you’re subject to how the chips (impressions) may fall. If you want a 20% control group the traditional way, you can manufacture that to happen. By using viewability as the determining factor, the size of your control group will be a function of your viewability rates and impression scale.
What It Can Help You Answer
Some of the difficult questions this can help answer: What’s the value of a view-through conversion? Would retargeted users convert anyway without the help of display? Is the time to convert shorter for someone exposed to a display impression? Does that differ by frequency?
The industry has taken a long time to introduce viewability solutions and we have further to go before we fully account for payment standardization and measurement limitations. But the progress we’ve made thus far could be enough for an industry shift in the options available to marketers to execute on these types of media effectiveness studies.
Notable Caveats
Project Iceberg 2.0 only considers the evaluation of display media. It doesn’t account for user exposure and influence from other marketing channels, such as search or email, but it’s a capability.
SQL was not used to analyze the data. I applied filters and metrics in Adobe Data Work Bench to the dataset to tease out the test and control groups that inherently existed in the underlying data.
Follow Matt Scharf (@Matt_Scharf), Adobe (@Adobe) and AdExchanger (@adexchanger) on Twitter.