This article is sponsored by Adelaide Metrics.
In the classic Where’s Waldo? books, Waldo was visible – but often well-hidden in a sea of other people. It often took several minutes before you could find him in the crowd – spotted only because of his famous red-and-white striped hat. Today, on many websites, ad placements have taken on Waldo-like characteristics – viewable, but not capturing much attention.
Viewability is important, and it represents an important hygienic step for the web to begin removing low-value impressions from the market. But where it becomes a problem is when advertisers conflate viewability as a measure of media quality.
Slowly but surely, viewability goals were put into place, and tools were developed to optimize placements to be highly viewable – instead of high quality.


Now, a decade after the 3MS initiative that led to viewability, it will take a new approach to restore high-impact ad measurement.
The Rise of Attention Metrics
The digital measurement space has come alive in the past couple of years with innovation around attention metrics. Just last month, The Attention Council released The Link Between Attention Metrics and Outcomes, a meta-analysis of more than 50 case studies proving the connection between attention and brand outcomes throughout the marketing funnel. Across more than 20 brand categories, overwhelming evidence demonstrated the benefits of attention metrics compared to existing metrics like viewability and completion rate.
To see how attention is rewriting ad measurement to bring outcomes back to the forefront, let’s take a closer look at three examples from the report. Please note, the data in each of these studies has been indexed to protect the privacy of our clients:
Case study #1: Attention optimizations increase brand lift for a healthcare client

This A/B study was conducted by a large healthcare brand focused on driving upper-funnel business outcomes. Our findings reveal that attention-optimized placements yielded 85% greater impact on brand familiarity and 77% greater impact on brand perception than viewability-optimized placements, as verified by a third-party brand lift vendor.
Case study #2: Proving the link between attention and lower-funnel action per impression for a financial services brand

This financial services brand wanted to better understand the quality of their media for an open-web display campaign, as well as improve their price-to-performance ratio, a primary KPI. The study indicates a very strong positive correlation between attention and lower-funnel action per impression. High attention media drove 2.5X the number of transactions – or customer deposits – for the bank compared to low attention media.
Case study #3: Driving brand lift and efficiency gains for a technology client
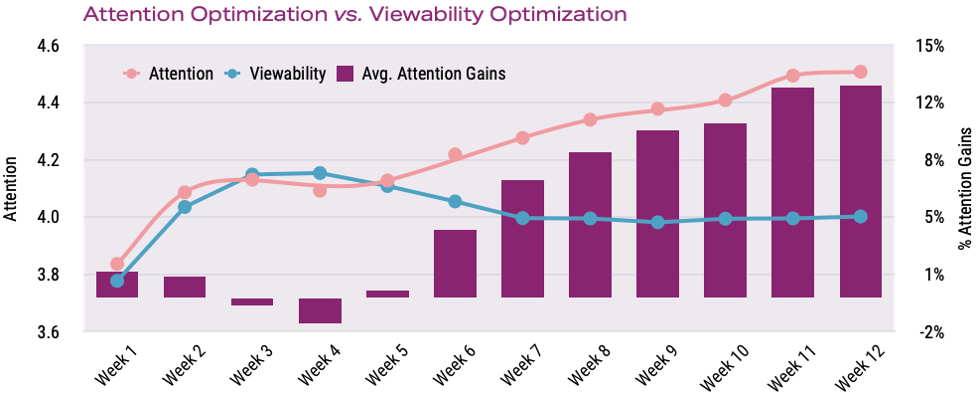
One of the most recognized technology brands in the world sought a more efficient and effective method for driving brand lift. In this final study, one group of viewers was exposed to attention-optimized media, while another was exposed to viewability-optimized media. The attention-optimized group tracked 6% higher familiarity and 20% higher unique reach than the viewability-optimized group. Attention optimizations also led to 12.8% higher average attention and proved 31% more cost effective.
Upgrading Your Metrics
Using attention metrics as measures of media quality is a nuanced undertaking. For example, sometimes duration is a key measure of placement quality, while other times it indicates creative relevance. To solve this, Adelaide has created a single metric, AU, which aggregates many different signals using a machine learning algorithm that predicts the likelihood of attention.
The best way to get started – and begin learning how attention metrics can drive your brand’s success – is to lead with an A/B test comparing attention metrics to viewability. Split your media (or users, if possible) into two segments and optimize one toward viewability and the other to attention metrics. Then, compare the incremental outcomes from both media segments to see which delivered the most efficiency.
If you’re like most advertisers, you’ll quickly find the benefits of attention metrics faster than you can find a guy with a striped hat.